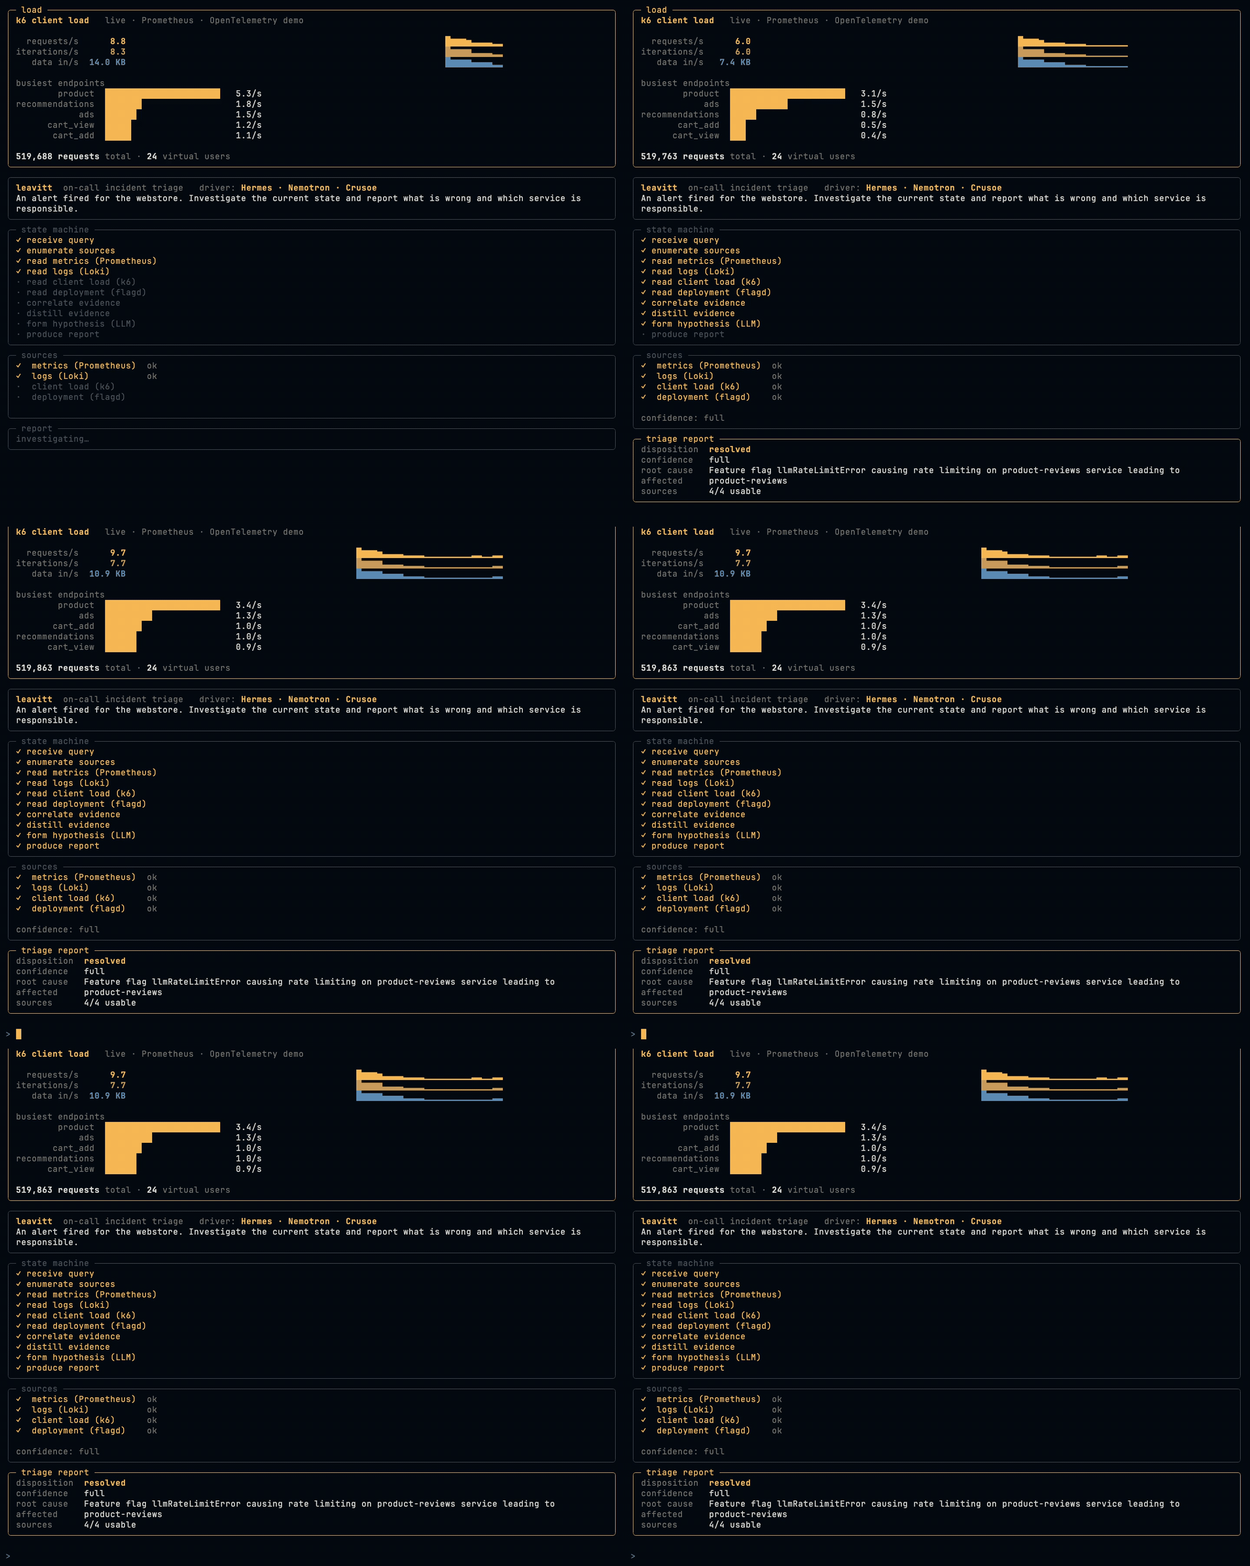
Leavitt reads observability dashboards, metrics, logs, client-side load, and deployment changes, correlates them, and reports what broke and why. It ships as a Hermes agent running NVIDIA Nemotron on Crusoe Cloud managed inference, runs as a standalone terminal app, and schedules as an unattended worker. Because every action is read-class, you can leave it pointed at production.
Built on Theodosia: the triage workflow is a Burr state machine mounted as an MCP server, and the agent drives it one validated transition at a time. The graph holds only read actions, so the model diagnoses with no way to act on what it observes, and resolved requires full source coverage and a cause grounded in the observed signal. When a source fails mid-investigation it continues and marks the report degraded; when nothing usable comes back it returns inconclusive rather than inventing a resolution.
$ leavitt investigate "An alert fired for the webstore. Root cause?"

disposition:       resolved
root cause:        llmRateLimitError feature flag is rate-limiting the
                   product-reviews service, cascading to frontend
sources usable:    4/4 (grafana_metrics, grafana_logs, client_load, deployment_context)
Two governance layers on one agent: Hermes sandboxes what the agent can touch, Theodosia enforces the workflow it must follow. The credentials to the observed backends live in the Leavitt server, never in the driver, so no agent can reach the dashboards except by asking Leavitt to read them. Challenge Winner at the DevNetwork AI + ML Hackathon 2026 (Crusoe). Apache 2.0.