6 minutes
All the Difference | My UNICEF Winternship: Part III
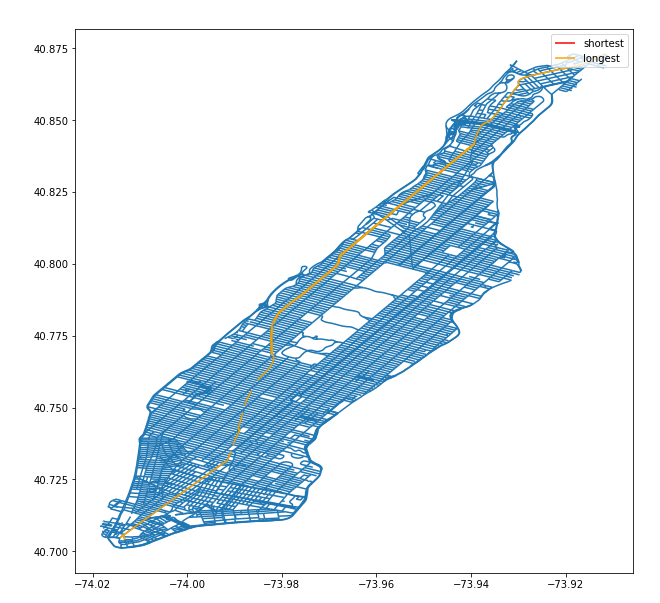
My winter algorithms course at Wesleyan had me falling in love with the graph data structure. Vertices and edges entwined to form a vast web that could abstract anything from a series of highways to a social network, and with so much literature and research on how to conduct analysis on graphs, I sought the holy grail of capturing an entire country’s road network in this structure so I could leverage shortest-path algorithms.
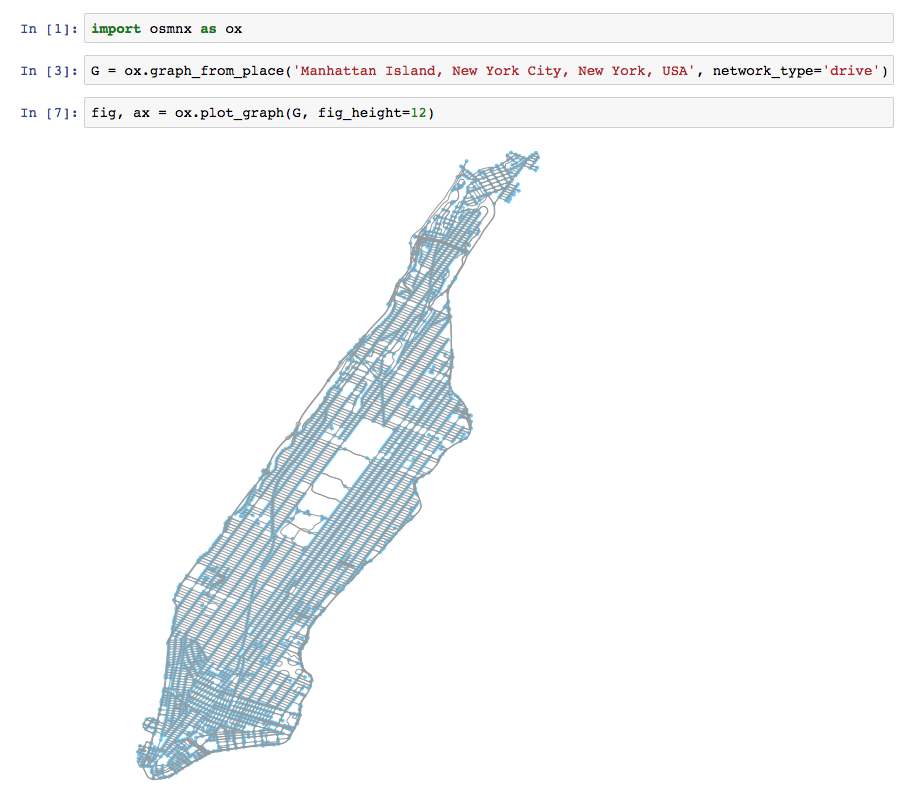
So imagine my surprise when I found the perfect library - Geoff Boeing’s OSMNX, which uses OpenStreetMap APIs and Python’s NetworkX graphing library to convert roads, pathways, streets, etc. into a graph that one could manipulate and conduct analysis. Just take a look at Manhattan’s roads visualized as a graph data structure - through code, I could walk around the city, see how long each road was, and most importantly - compute shortest-paths between sites!
To recall the problem statement for Magicbox - for each location (e.g. school, population point) in a given list of geographic coordinates, identify the distance / travel time to the nearest health facility (or other kind of location). I referred to the schools or population points as origin sites, and the health facilities as destination sites.
Therefore, given a graph of the road network and the two source and destination datasets (usually .geojson files containing latitudes and longitudes for schools and health facilities) - The algorithm would run as follows:
- For each origin site, find its nearest node on the graph, we label this as the origin node and save the distance between the site and the node
- Do the same for each destination site but label the nearest node as the destination node
- Compute all pairs of shortest paths between origin node and each destination node, to optimize, we use an approach known as dynamic programming to save shortest paths so that when two sites share the same source node, we don’t recompute, but lookup from a table instead
- Once a shortest path is successfully found, add the length of that path to the distance between the origin site and the origin node, and to the distance between the destination site and the destination node - voila !
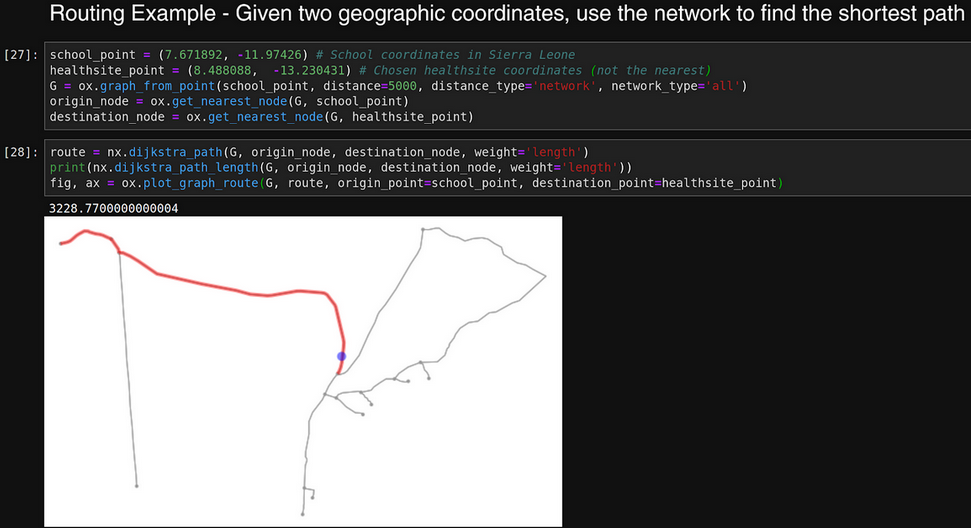
 A routing example in OSMNX.
To optimize further, I told the algorithm to first compute straight-line distance for all origin sites, and only compute the routed distance if the straight-line distance was greater than one kilometer, since that distance could be reliably walked.
I consulted with my supervisors and members of the data science team about whether or not I had the right approach, and I would continue to refine as I incorporated the feedback I received. The example below shows a Jupyter Notebook excerpt from my code:
My algorithm was complete, and eager to show this to my supervisors, I loaded it on a souped-up virtual machine that the Magicbox developers would be using to preprocess all the data. I wrote two utilities - one that retrieved all the road graphs from OSMNX and stored it on the VM, another to compute the distances. Although computations for straight-line distance were reliably speedy, to my disappointment, routed distance computations took their sweet time even with the dynamic programming optimization.
This challenge - optimizing the distance calculations to ingest huge datasets - was what would ultimately test my resourcefulness and problem-solving, and I developed two means of addressing this - refactoring my code to include concurrency, and porting these graphs to a faster graph library.
Concurrency is the ability of a program’s different components to run out-of-order - for example, to leverage the benefits of a multi-core CPU, different functions could be assigned to different cores so that they could all run in parallel and return an output faster than if they were done in order. This meant I had to identify the pieces of my code that could be run out-of-order - for example, when computing shortest paths between all pairs of nodes in the graph, one path isn’t dependent on another graph, so I could actually compute them all at once!
I knew just what to refactor, but I knew that Python’s NetworkX library could still not handle the load of all of these computations at a desirable pace. With luck, Geoff Boeing has provided a method in OSMNX to convert NetworkX graphs to iGraph format, a different Python graph library which uses C++ bindings for greater speedup.
However, iGraph presented multiple difficulties when attempting to install on my machine and the virtual machine, so I decided to experiment with Docker. Docker allows one to run virtualized containers that are bundled with their own software and libraries for easier development, so I decided to run a container that was already configured with both OSMNX and iGraph.
It worked beautifully.
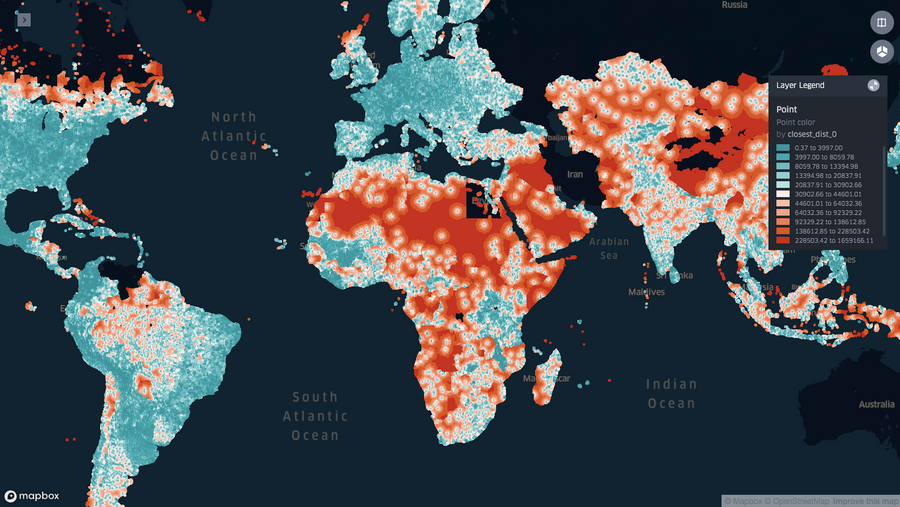 Global output, color representing distance to nearest healthsite.
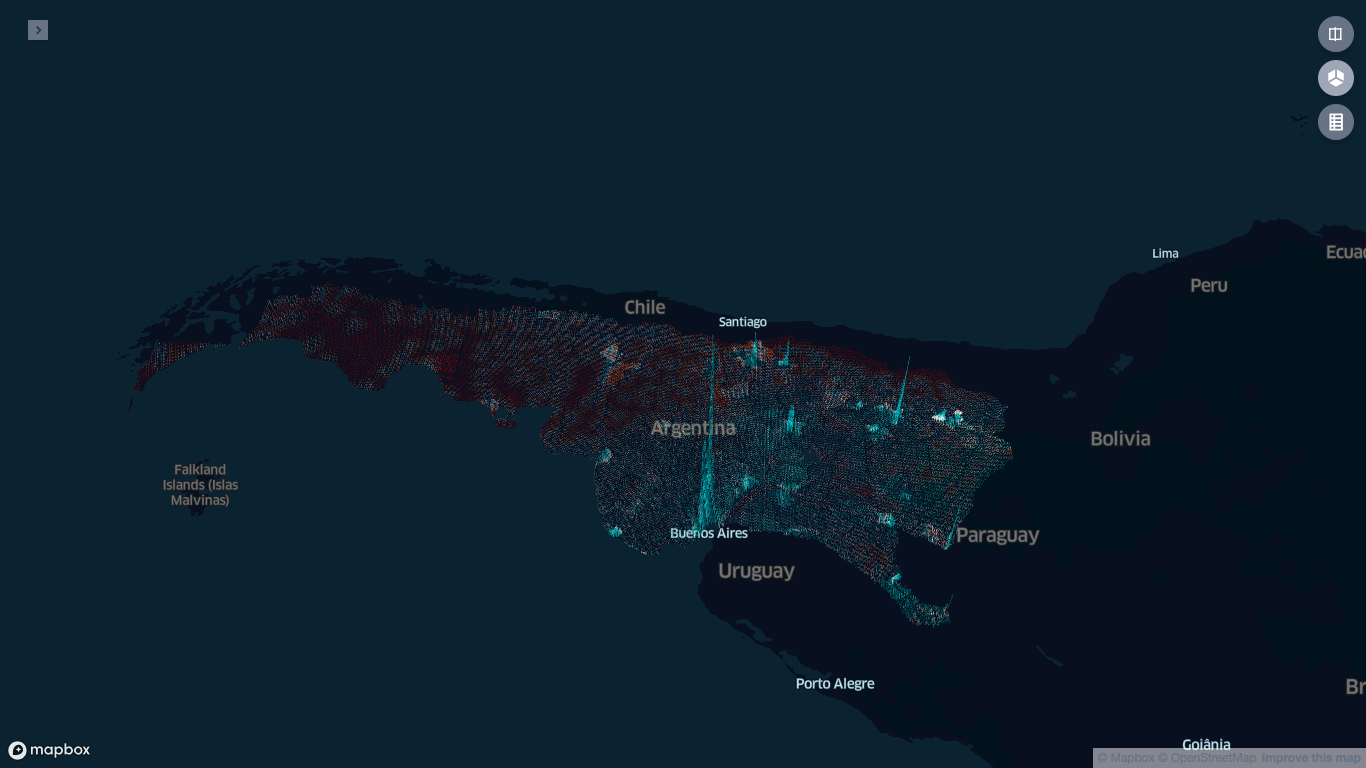 Additional output in kepler.gl with color representing distance, and height representing population.
It was mesmerizing to see my terminal spit out successful outputs at a blazing pace, and when I opened up the final result on kepler.gl, I was so elated at how it all seem to cohere with my previous results.
I continued to polish up my code as the start of my final semester approached, improving documentation and refactoring method and variable names for clarity. The UNICEF innovation team threw me a small impromptu party as I prepared to pack my bags and head to Grand Central to depart to Middletown, Connecticut.
My previous questions of “how did I get here?” and “what do I do?” became “man, already?”. My hunger to finish school and take a deep dive into the world of software development and data science was intensified, and even as I was inundated with new assignments and theatrical responsibilities, I found myself adding more optimizations to my repositories and editing documentation.
In mid-February, I gave my final presentation to the UNICEF Innovation team - “The Road(s) Not Taken: Mapping Vulnerability through Data Preprocessing and Network Algorithms” - describing my approach and results. I slipped in a not-so-subtle Robert Frost reference, alluding to the work I had done on roads, but also as a personal reminder.
This internship was a test of my ambition and ability. It allowed me to take leaps of faith and trusted my capacity to internalize technical concepts to manifest them into real-world solutions. It warms me to this day to see the code that I had crafted in two months being used for a true purpose, and it has been the ultimate encouragement in getting myself out there and tackling further challenges. In deciding to work for UNICEF as a Magicbox Engineering Intern that winter, I took the road less travelled by - and that has made all the difference.
 Thank you everyone! With love, Adam.